KPIs: What matters?
In many places, it has become practice to refer to all key performance indicators as KPIs. However, the inflationary use of KPIs is misleading, since by no means are all performance indicators actually the “key” to achieving a goal.
Target definition for business units
Before defining KPIs, a company must first define global and regional targets for business units. It makes sense to define KPIs per area – for example, for marketing, sales, finance, logistics – as well as across areas at a higher management level.
Different KPIs per unit
The focus of each unit is reflected in the KPIs. While dwell time and frequently clicked content are important sources of information in the online sector, other decision-makers are interested in the cost per acquisition or the conversion rate. Corridors with specific recommendations for action should be defined for the KPIs so that concrete actions can be implemented if they are exceeded or fallen short of. Different KPIs can be sorted according to importance and, if necessary, combined in a weighted index.
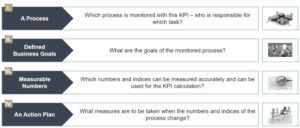
Requirements for a useful KPI
Common mistakes with KPIs
A common mistake is creating too many key figures: Information needs to be to the point. Those who list 50+ KPIs for one area have a wrong understanding of key performance indicators. The goal should be a handful of KPIs per strategic business objective and area.In addition to a flood of KPIs, other mistakes include KPIs that are too vaguely defined and unclear responsibilities, as well as KPIs that do not properly reflect successes and failures. KPIs from other companies are not necessarily good metrics for your own area.
The acronym SMART (Specific, Measurable, Achievable, Result-oriented, Time-bound) has proven itself in the creation of KPIs.
Dashboards – the clear presentation of data
A dashboard is a page that uses graphs and metrics to provide an easy-to-understand overview of a topic. Business intelligence software such as Qlik Sense, Power BI or Tableau is often used. Different data sources can be easily merged and adjusted here. This is an excellent basis for creating reports and interactive reporting tools. The applications go beyond classic Excel spreadsheets and offer significantly more freedom in visualizations of large data sets and additional features. Dashboards can be quickly updated or shared, and automatic notifications can be sent when metrics exceed or fall below thresholds.
What dashboards need to do
Dashboards should not be data graveyards with long tables but should paint an easily understandable picture. A good dashboard tells a clear story. Often, graphical elements rely on chart types such as scatterplots, bubble plots, tried-and-true bar, column, and pie charts, or easy-to-understand speedometer and traffic light illustrations.
Advantages of dashboards
A clear advantage is the intuitive interaction with dashboards – drilldowns, zoom functions and filters allow a quick dive into data on different hierarchy levels. This allows trends and anomalies to be identified and what-if scenarios to be analyzed. The goal is to present complex multidimensional company data in a clear and concise manner.
QlikSense-Tool
All important data at a glance: KPI dashboards
The combination of clearly defined KPIs and easy-to-understand graphics is an excellent basis for decision-making. Based on KPI dashboards, strengths and weaknesses as well as opportunities and risks can be identified in a targeted manner.
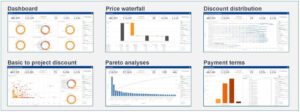
Topic-specific dashboards for the company homepage, the online store or business units from different countries and areas provide the necessary level of detail. While a management dashboard tends to be limited to the “big picture”, a controlling cockpit, a marketing KPI dashboard or a salesforce dashboard can convey information in a way that is appropriate for the target group:
- Was my last price increase successful, i.e. was it implemented in the market?
- Is our discount system globally consistent or at least modular?
- How are my countries and regions performing and what are the causes?
- Where do I have margin leakages that urgently need to be closed?
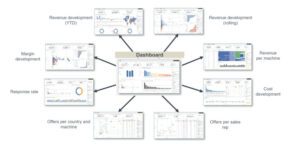
Prototypical implementation of User Stories
KPI alarm
The combination of interactive real-time data and alerts makes it possible to act immediately when a KPI alert is raised. Prediction and forecasting models can be easily added and help to estimate the development of KPIs. The relevant software tools are very user-friendly in application and can be used even without in-depth IT knowledge.
Project examples and experiences
Prof. Roll & Pastuch – Management Consultants has many years of experience in the creation of business intelligence applications and in the definition of suitable KPIs. We are happy to develop modern and interactive KPI dashboards for you that will help you in your daily business.
Roll & Pastuch supports you in merging different data sources, defining meaningful KPIs, as well as in preparing them in the form of dashboards in a way that is appropriate for the target group.
Take off with good KPIs and smart dashboards
Let’s work together to unlock the potential in your data so you can make decisions faster and achieve your business goals. We will be happy to answer any questions you may have and to exchange further information.

Kai Pastuch
Kai Pastuch is Managing Director of Prof. Roll & Pastuch – Management Consultants. Before joining as Managing Partner, he was Director at a leading international strategy and marketing consultancy. As a graduate in business informatics, he also manages our software company nueprice, which specializes in the pricing of spare parts with the product of the same name. Mr. Pastuch has extensive project management experience from numerous projects for large international companies and German medium-sized businesses in the areas of price management, marketing, sales and strategy. In addition to numerous publications in renowned journals and the publication of the reference books Praxishandbuch Preismanagement and Big Deal Management, he is a sought-after moderator and speaker on all aspects of sales and pricing. As a practice-oriented manager, he likes to get personally involved in our projects and contributes his broad experience in workshops and steerings.